6 key fulfillment metrics and how to use them for D2C success
Analyzing your fulfillment metrics can help you optimize and scale your brand across all areas. In this blog we will take a look at six key metrics to track for e-commerce success.
Keeping a close eye on your fulfillment metrics helps you across multiple aspects of your company. In this blog post, we will take a look at five key fulfillment metrics and how each one can help you to optimize and scale your processes.
Metrics we will take a look at:
- Average items per shipment
- Shipment issue rate
- Share of issue type
- Share of picked items scanned with barcode
- Return reasons
- Click-to-door speed
1. Average items per shipment
The number of average items per shipment gives you insights into:
- the performance of marketing campaigns or bundles
- your brand equity
- market performance
- optimization potential by using features like kitting
Campaign or bundle performance
Checking out your average items per shipment over time can help you see when certain marketing campaigns or bundles are working. A higher number of items does not always mean a higher average order volume (AOV), but often the two are correlated.
Brand Equity
High average items per shipment can also be an indicator of brand equity. Let’s say you have a meal kit company, customers ordering more items in every order shows that they trust you with their nutrition and likely aren’t just trying it out for the first time.
Market Performance
Furthermore, if you ship internationally, looking at the average items per shipment filtered by country can help you identify where you have strong brand equity and successful campaigns, and which countries might need an extra marketing push.
Optimization potential
Plus, if you see a high number of average items per order it can be worth checking out if there are any patterns in which SKUs are being added. If certain products are consistently ordered together, you could consider combining them into a pre-kitted bundle to decrease your fulfillment costs.

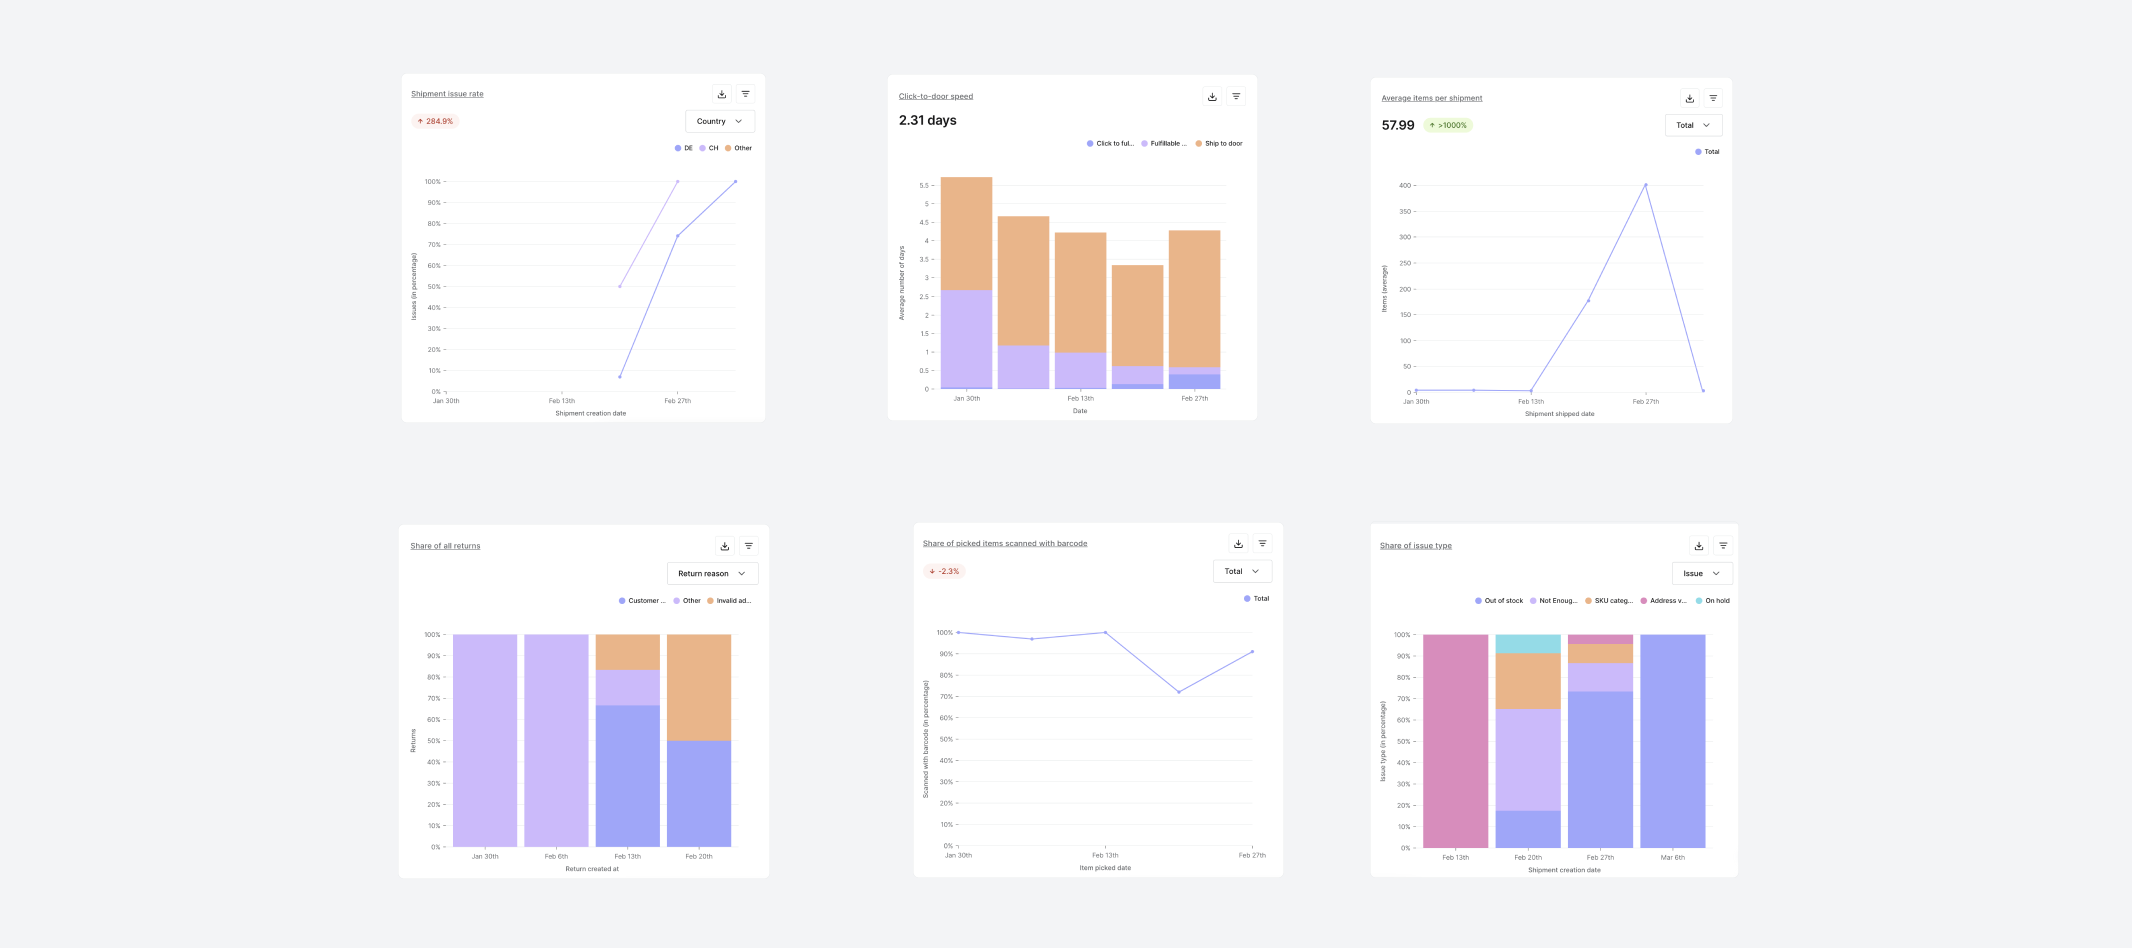
2. Shipment issue rate
What is the shipment issue rate?
The shipment issue rate shows the percentage of orders which have an issue with them.
Keeping tabs on your shipment issue rate helps you get an overview of specific periods where there are higher rates of errors.
For example, maybe you notice that in the summer you have a higher rate of issues. This could be because of a new product launch which went out of stock too quickly, or that higher temperatures have caused an issue with one of your SKUs.
Having a clear overview lets you detect patterns early so you can find solutions quickly.
Plus, if you have introduced a new measure to improve your stock forecasting or delivery, looking at your shipment issue rate is a great way to get an overview to see if it is working.

3. Share of issue type
What is the share of issue type?
Share of issue type is the percentage each type of issue takes up in the pool of your issues.
Looking at how many issues your shipments have is not enough. Looking into your share of shipment issues helps you figure out which issues in particular are taking up your time, and help you find some quick wins.
For example, if the majority of your shipment issues are from incorrect addresses, implementing an address validation feature could help you win back hours of valuable customer support time and improve your customer happiness.
Or maybe you have a large quantity of issues with products going out of stock – it could be time to review your inventory forecasting strategy or to plan further in advance with specific marketing campaigns.
4. Share of picked items scanned with barcode
This one may not immediately sound like a metric you would keep a close eye on. However, the share of items picked with a barcode tells you a lot about how your products are being fulfilled and if there is potential to improve it.
Picking with a barcode improves your order accuracy and speeds up your fulfillment time as associates in the fulfillment center do not have to manually confirm your item.
Plus, it can indicate if a barcode is not working if your share of picked items scanned with barcode suddenly decreases – tracking this metric lets you react in time.

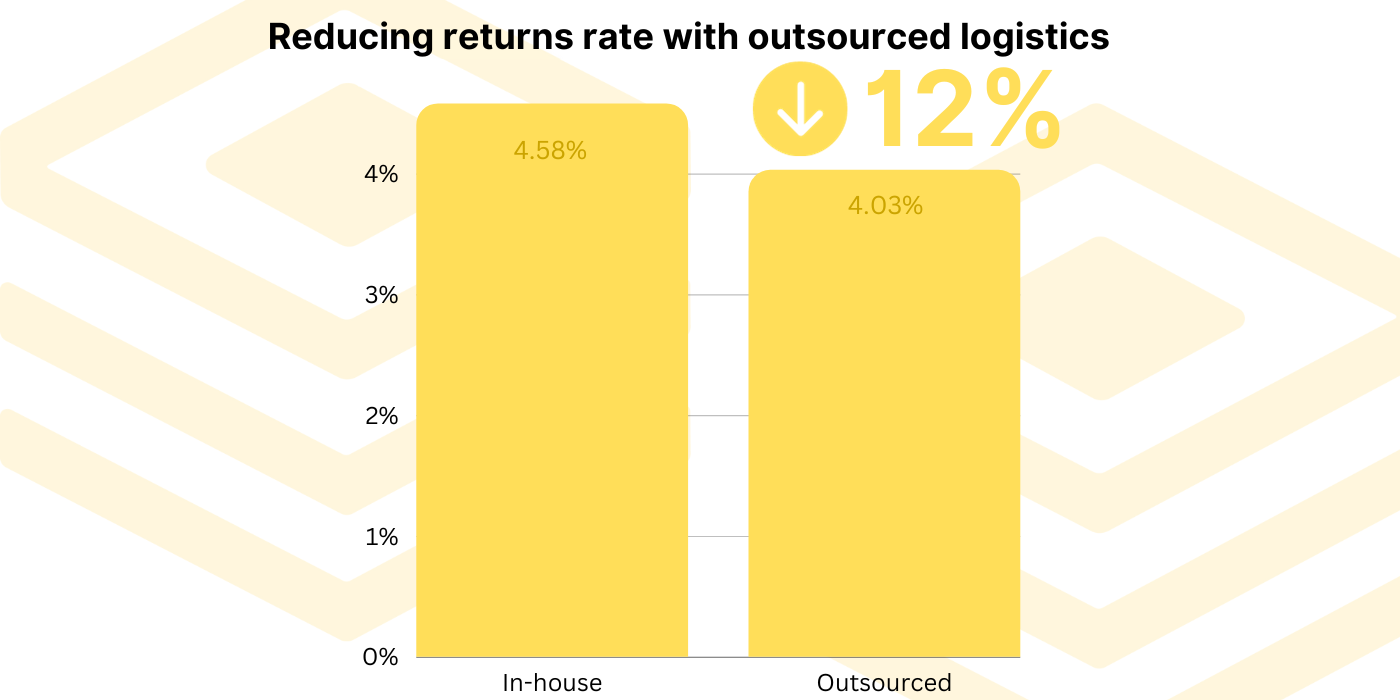
5. Return reasons
Analyzing your return reasons lets you optimize your order fulfillment and scale your ecommerce business in several ways.
You can:
- identify areas of improvement in your business
- identify trends in customer behavior
- Understand customer preferences and needs
Identify areas of improvement
Understanding why customers are returning items can help you identify areas of your business that may need improvement. If you notice that a high percentage of returns are due to product quality issues or incorrect sizing, for example, you may need to work with your suppliers to improve the quality of your products or adjust your sizing charts.
Identify trends and customer behavior
Analyzing return reasons can help you identify trends in customer behavior. For example, if you notice that a specific product is being returned frequently, you may need to re-evaluate your marketing and sales strategies for that product.
Understand customer preferences and needs
Finally, analyzing return reasons can help you better understand customer preferences and needs. By identifying which products are being returned and why, you can adjust your inventory and product offerings to better meet customer demand and preferences.
6. Click-to-door speed
What is the click-to-door-speed?
Your click-to-door speed will tell you how long it takes between your customer clicking “buy” and the order arriving at their door.
The shorter the click-to-door speed is, the happier your customers are likely to be with their post-purchase experience.
Analyzing this speed as a whole can give you a great overview of how long your customers are waiting, but for even further analysis it is important to know what is taking up that time.
Your click-to-door speed will be influenced by three main factors, all individual metrics:
- click-to-fulfillment-rate: the time it takes for between your customer creating the order and the start of the picking process
- fulfillable-to-shipped: the time it takes to pick and pack the order (fulfillable to shipped)
- delivery time: and how long it takes for the order to be reach the customer once it has been shipped.
Looking at your click-to-door speed on this more granular level helps you to identify what is taking up the most time and where you can improve.
For example, if a lot of time is taken up between order creation and picking, it might be an indicator that you have issues with out-of-stock or missing customer details leading to delays.
Or if your delivery times are particularly high, it might be time to consider switching carriers or using a carrier mix.
Working with a 3PL partner with an integrated analytics suite
Working with a 3PL company that can provide you with these valuable analytics can help you to scale across multiple areas of your business. With Hive’s integrated analytics feature you can keep track of all of these metrics and more to make sure everything is running smoothly.
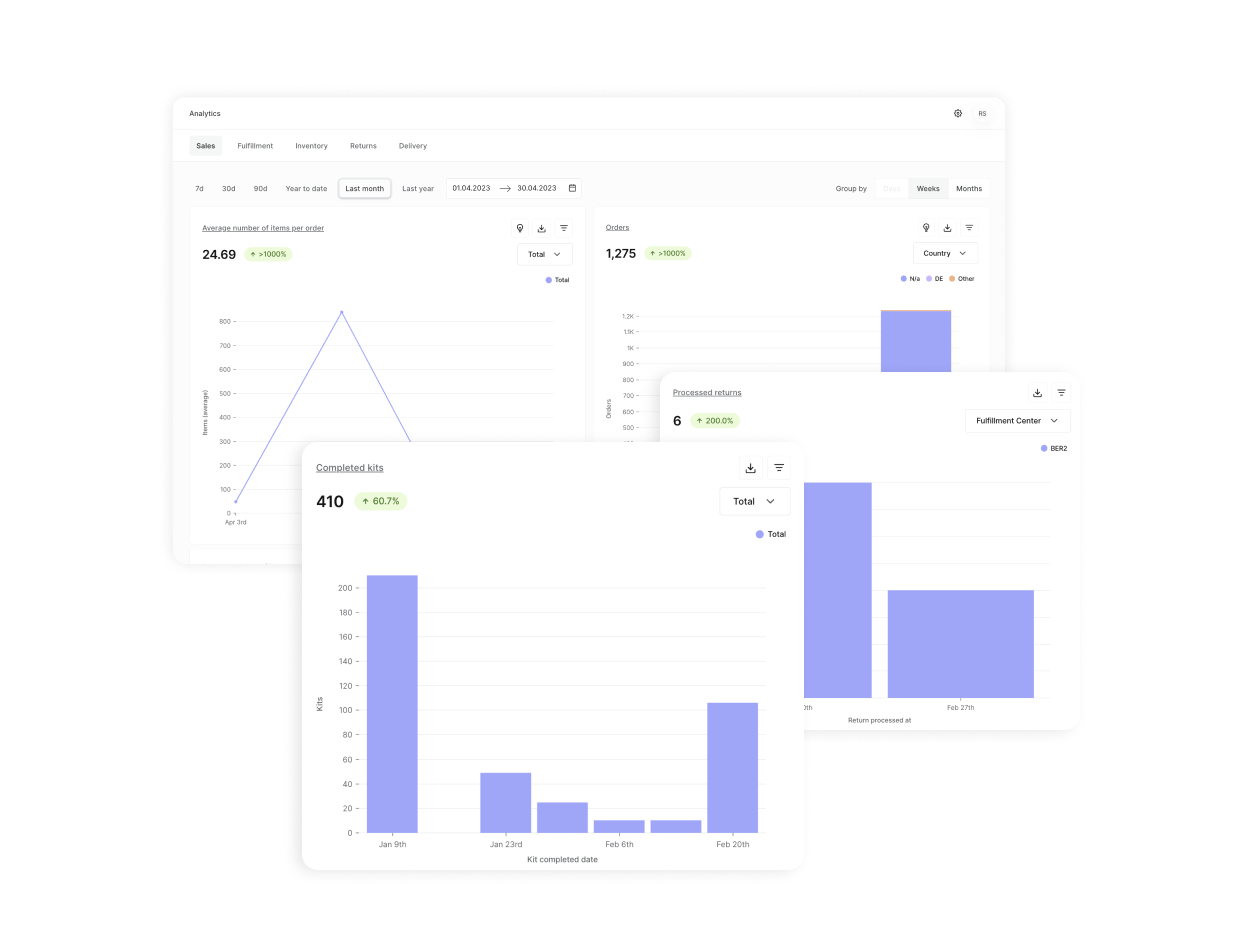
In Hive's analytics suite you can get access to a range of analytics related to sales, inventory, fulfillment, returns, and delivery. No third party tool needed - all of your operations and analytics are in one place. This means you always stay in control of your processes.
Interested in working with Hive? Find out more about the Hive App here.
.png)


.png)
.png)
.png)
.png)
.png)


.png)
.png)
.png)
.png)
.png)